|
|
|
|
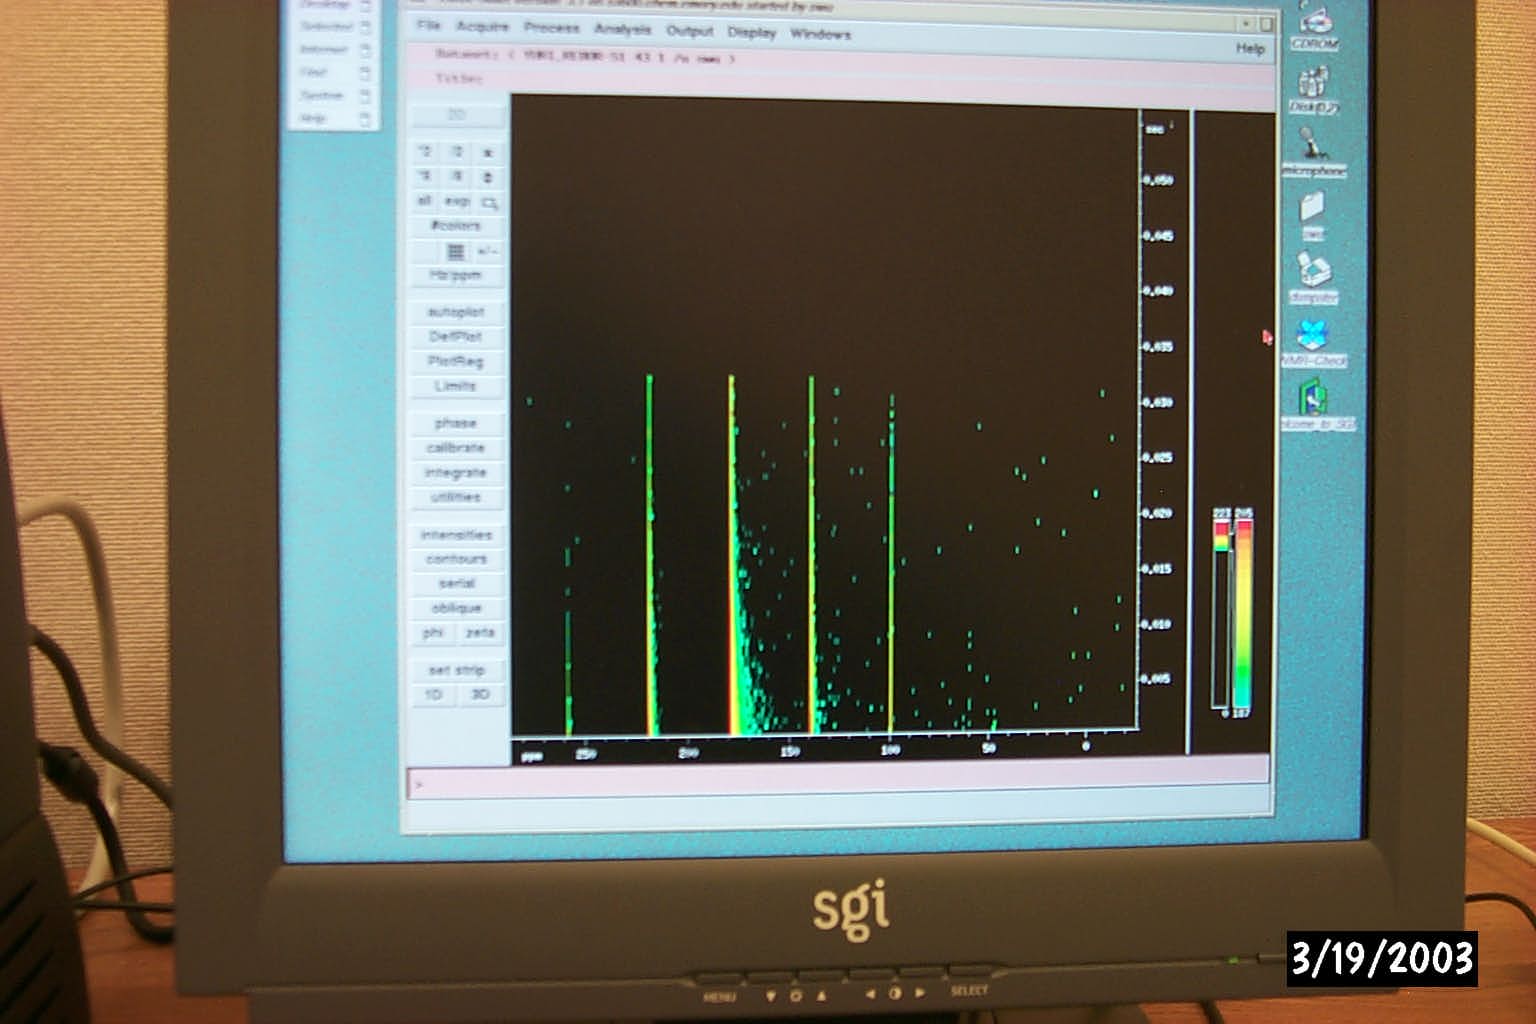
Processing: Load the data >wra # copy the data to new location for processing and keep the original data set. If it is a 2D data set, type xf2 to do FT on the f2 dimension. It takes each spectral slice into rows to make a pseudo-2D plot.
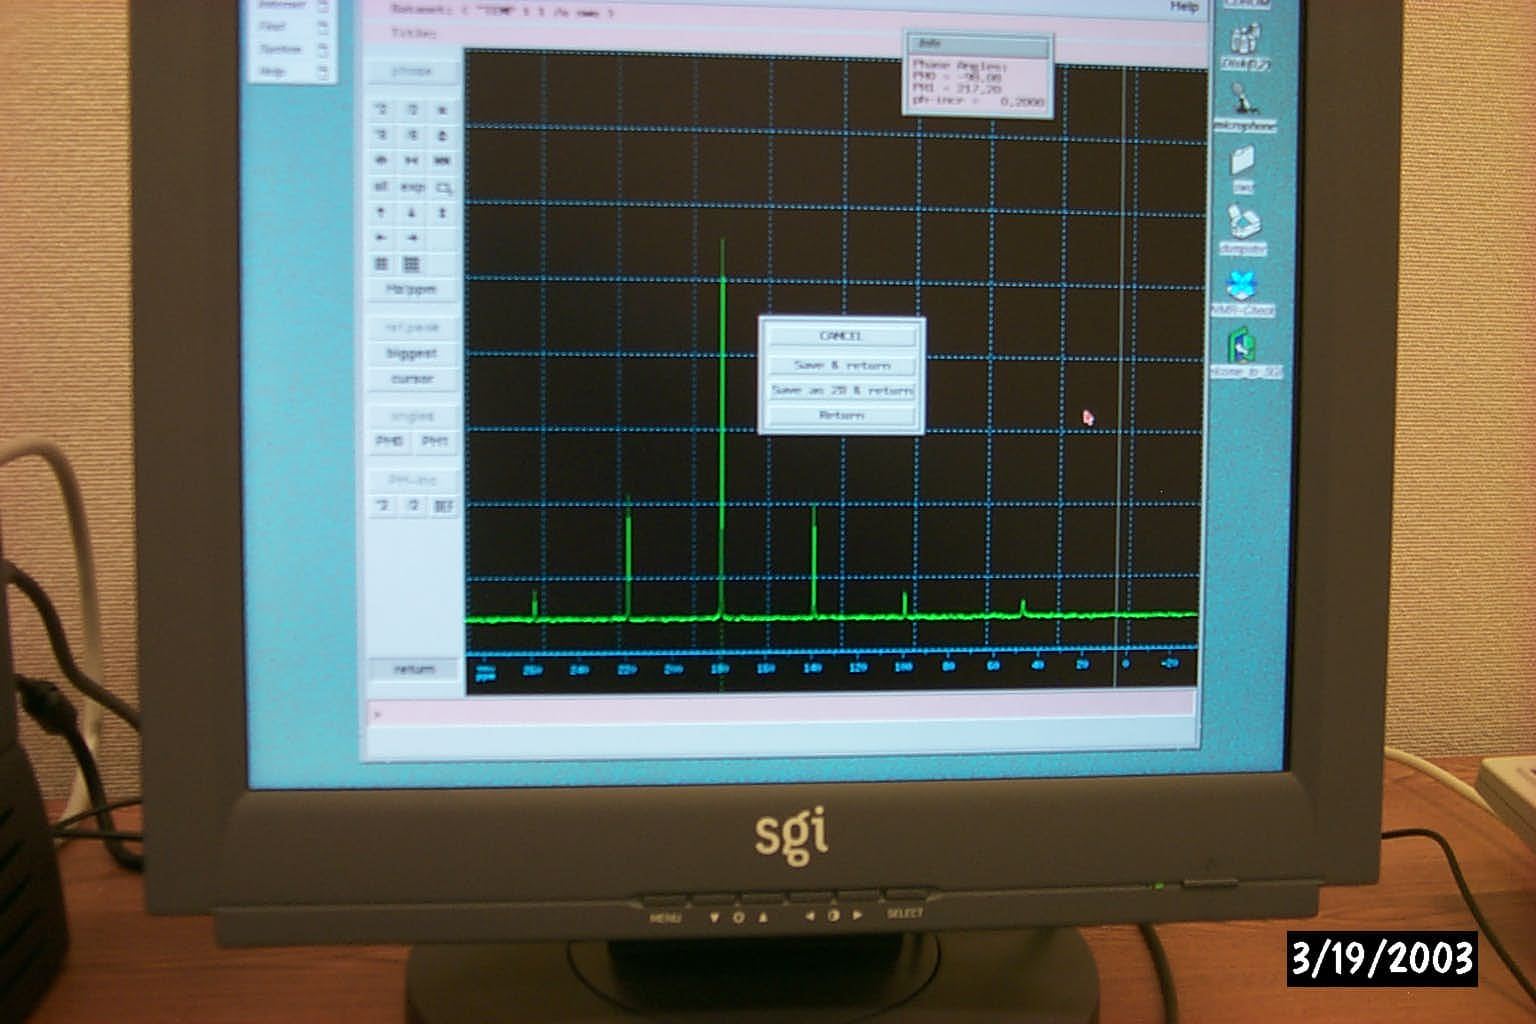
>rsr 1 retrieve the first spectrum, click phase, and biggest to phase the spectrum.
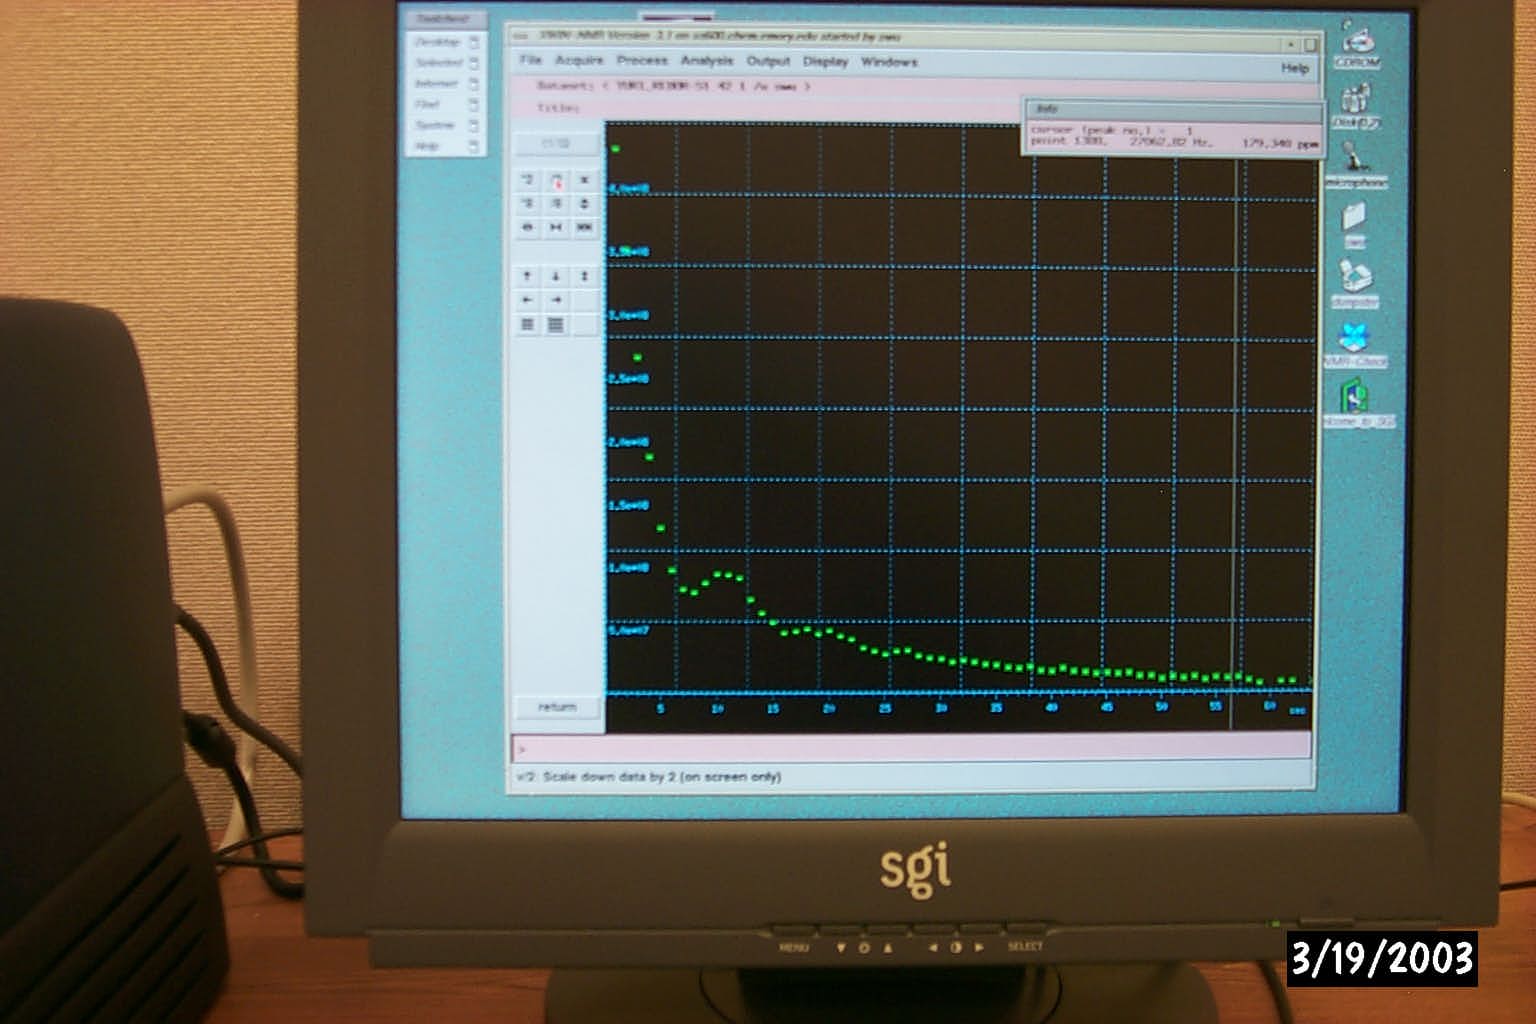
save as 2D* return. Click the 2D icon at left corner. Then type xf2p to do FT again. Note: edp à change PH_mod to pk, then the phase correction parameters are saved. >rspc 1 get the first slice. (Sometimes, the 1D spectrum does not show up, >edt1 and then do rspc 1) Click utilities à defpointsà use cursor to select the peak, then return save Click integral àuse cursor to set integral region; then return, save the integral. >t1/t2 >pd A REDOR curve will be displayed.
>ct1 Out put the data. >edt1 edit the parameters: FITTYPE area; LISTTYPE auto > t1/t2 the redor data will be displayed and then type lstp to print the data. Use edo to select output device. If we need the data to be transferred to PC use screen as output device. The file will be saved in /u/ -------/data set/pdata/ct1t2.txt. If you want to do few times, you could rename the ct1t2.txt, otherwise it will be overwrite.
|
|
|